

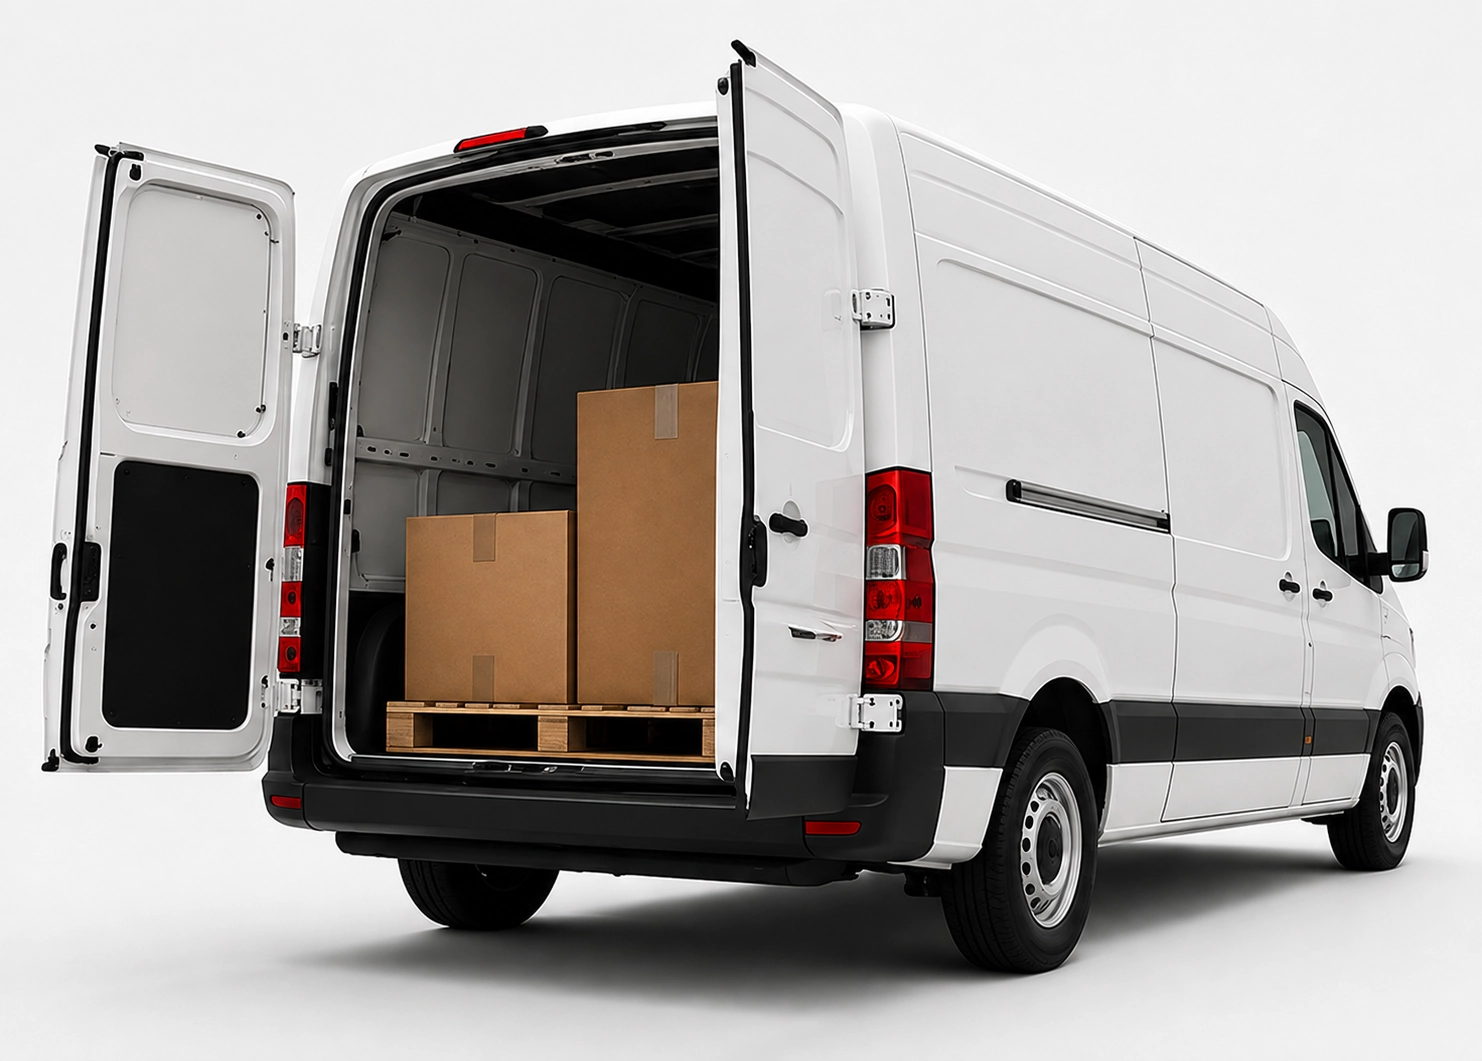
Express courier. Direct.
Also overnight.
x25pronto Switzerland takes goods direct to the destination. Small loads go by car. Larger loads go by van or Van XL. Direct, express and overnight trips run Monday to Sunday when a slot is free. Free times are shown in the booking calendar. This keeps the plan clear.
KPI set for courier costs: what operations managers should measure
Which KPIs help operations managers control last-mile courier costs? This KPI set explains key metrics, measurement methods and dashboard elements for informed decisions.
Quick answer
Operations managers should track five core KPIs: Total Cost per Delivery, Cost per km, On-Time Rate, Loads per Vehicle and Empty Mileage. Link booking and billing data with vehicle GPS, then build a simple dashboard in Power BI, Google Data Studio or Excel to spot trends and outliers.
Why a KPI set for courier costs matters
Courier services vary in price and performance. Without clear metrics, managers cannot see where costs arise. A KPI set reveals drivers: ticket rates, distances, utilisation and punctuality. That helps evaluate partners, optimise routes and explain budget variances.
The five core KPIs and how to calculate them
1) Total Cost per Delivery: sum of all courier costs (including fees) divided by number of deliveries. 2) Cost per km: total costs divided by driven kilometres. 3) On-Time Rate: share of on-time deliveries out of total deliveries. 4) Loads per Vehicle (utilisation): deliveries per shift or per vehicle. 5) Empty Mileage: share of non-revenue kilometres in total kilometres.
Measurement methods: data sources and linking
Use three sources: booking and invoice records from your courier portal, vehicle GPS from a telematics system and shipment status from tracking feeds. Match shipment IDs and timestamps. Aggregate by day and shift to reduce distortion from outliers.
When to investigate deviations and act
Set thresholds: e.g. Total Cost per Delivery +10% vs budget or On-Time Rate <95%. If exceeded, check route planning, load factors, parking and wait times, pickup windows or external surcharges. Short-term actions: change pickup windows or priorities. Medium-term: route consolidation, bundling rules and clearer handover standards.
Dashboard: structure and visualization ideas
Provide three levels: overview (top KPIs), root-cause analysis (cost drivers by zone, customer or partner) and detail logs (individual trips). Visuals: time series for cost per delivery, heatmap for empty mileage by area, bar chart for on-time by partner and Pareto for customers by cost share.
Practical tips on data capture and quality
Automate wherever possible. Required fields in bookings (package size, delivery window) cut follow-ups. Validate GPS routes by sampling. Run monthly data audits. Document assumptions (e.g. how partial deliveries count). Clean data speeds up analysis.
Frequently asked questions
How often should I report the KPIs?
Weekly for operational control and monthly for strategic decisions. Daily checks can help during peaks or special projects.
Which tools work best for a dashboard?
Power BI, Google Data Studio or a well-structured Excel workbook are often sufficient. The key is data connectivity and simple filters for time, region and partner.
How to measure empty mileage reliably?
Use telematics GPS data and assign trips clearly to orders. Empty mileage is distance between jobs or to/from depot without an active delivery.
How to set benchmarks for cost per delivery?
Start from historical averages and segment by region, parcel size and urgency. That creates realistic targets per segment.